
Running a wholesale store means making decisions based on numbers: which products move, which customers buy the most, and whether your wholesale revenue is growing. Wholesale Suite’s built-in Wholesale Analytics dashboard gives you all of that in one place, updated in real time without leaving your WordPress admin.
This guide walks you through each view of the dashboard so you know exactly what you’re looking at and how to use it to make smarter decisions for your business.
Prerequisites
- WooCommerce Wholesale Prices Premium installed and activated.
- Your WordPress user account needs WooCommerce management permissions, which the Shop Manager and Administrator roles both include.
- At least a few wholesale orders in your store so the dashboard has data to show.
How to open Wholesale Analytics
- Log in to your WordPress admin area.
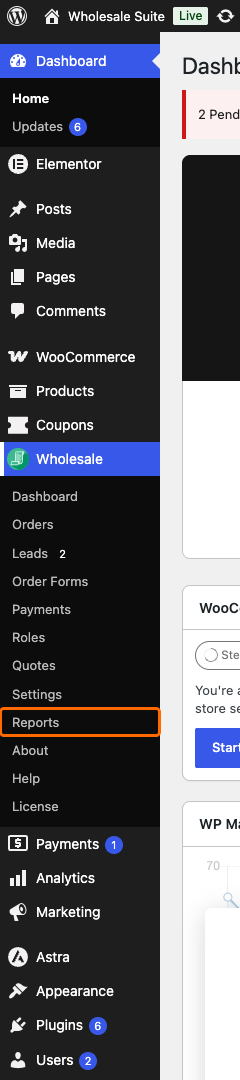
- In the left-hand menu, go to Wholesale → Reports.
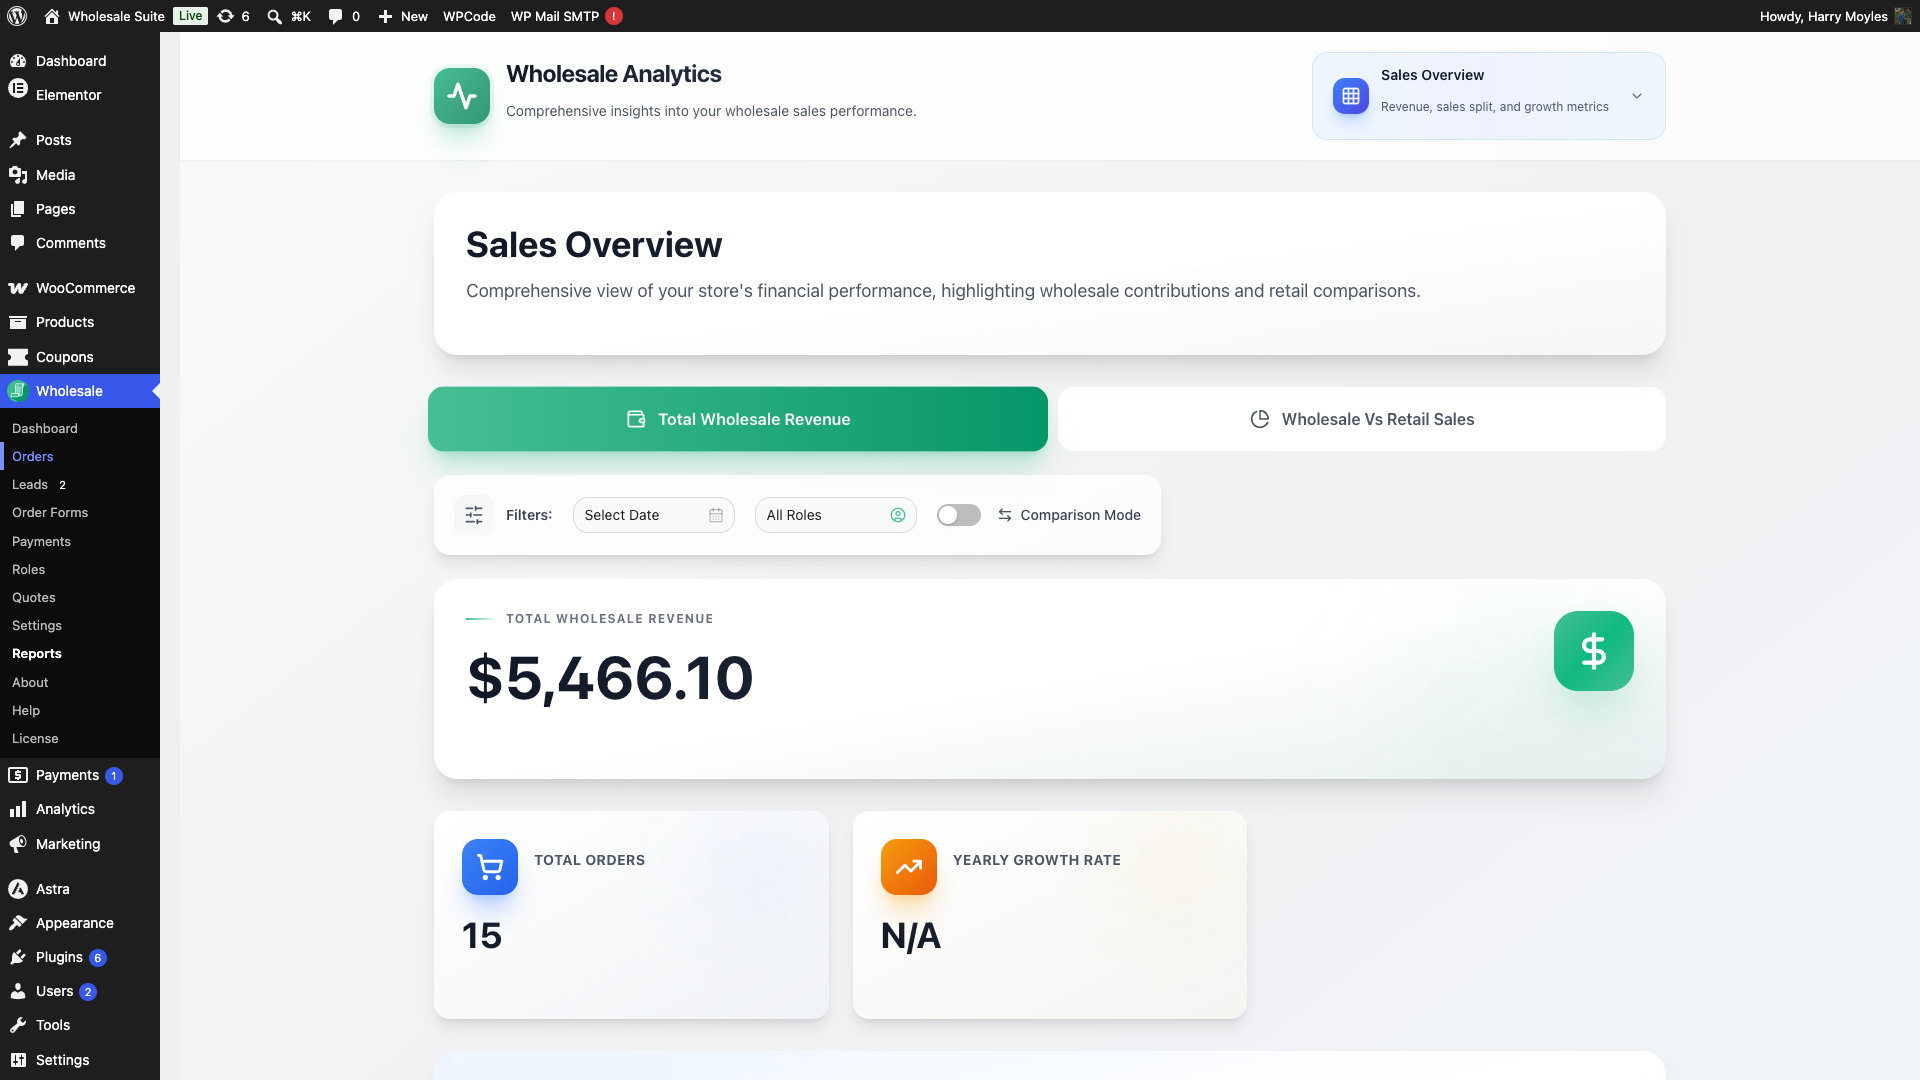
The dashboard opens on Sales Overview. There are four views in total, and you switch between them from the dropdown in the page header, which always shows the view you are on: Sales Overview, Product Sales Overview, Product Performance Analytics, and Order Insights.
Understanding the filters
Before diving into each view, it’s worth knowing the filters that appear across the dashboard. They control which data you see everywhere.
The date dropdown lets you narrow down the time period you are analysing. It defaults to Select Date, and the options are Last 7 days, Last 30 days, Last 90 days, Last year, and Custom, where you pick your own start and end dates.
Role Filter filters all the charts and tables to a specific wholesale customer role, useful if you have multiple tiers (for example, “Wholesale Customer” and “Distributor”). By default it shows all roles combined. The same dropdown is also where you switch into Role Comparison mode, covered in the next section.
The category dropdown, available on the two Product views, narrows the product data to a specific product category. This helps when you want to focus on one area of your catalogue.
Comparison Mode is a separate toggle that turns on a time-based comparison: it lets you benchmark the current date range against a previous period. When enabled, a “Compare with:” date picker appears below the filter row so you can choose the comparison range.

Comparing wholesale roles side by side
If you run multiple wholesale tiers (for example “Wholesale Customer”, “Distributor”, and “VIP Wholesale”), Role Comparison lets you see how each tier performs against the others on the same screen. Instead of switching the Role Filter between roles and comparing numbers in your head, the dashboard shows one column per role in every comparison-aware card.
How to enable Role Comparison
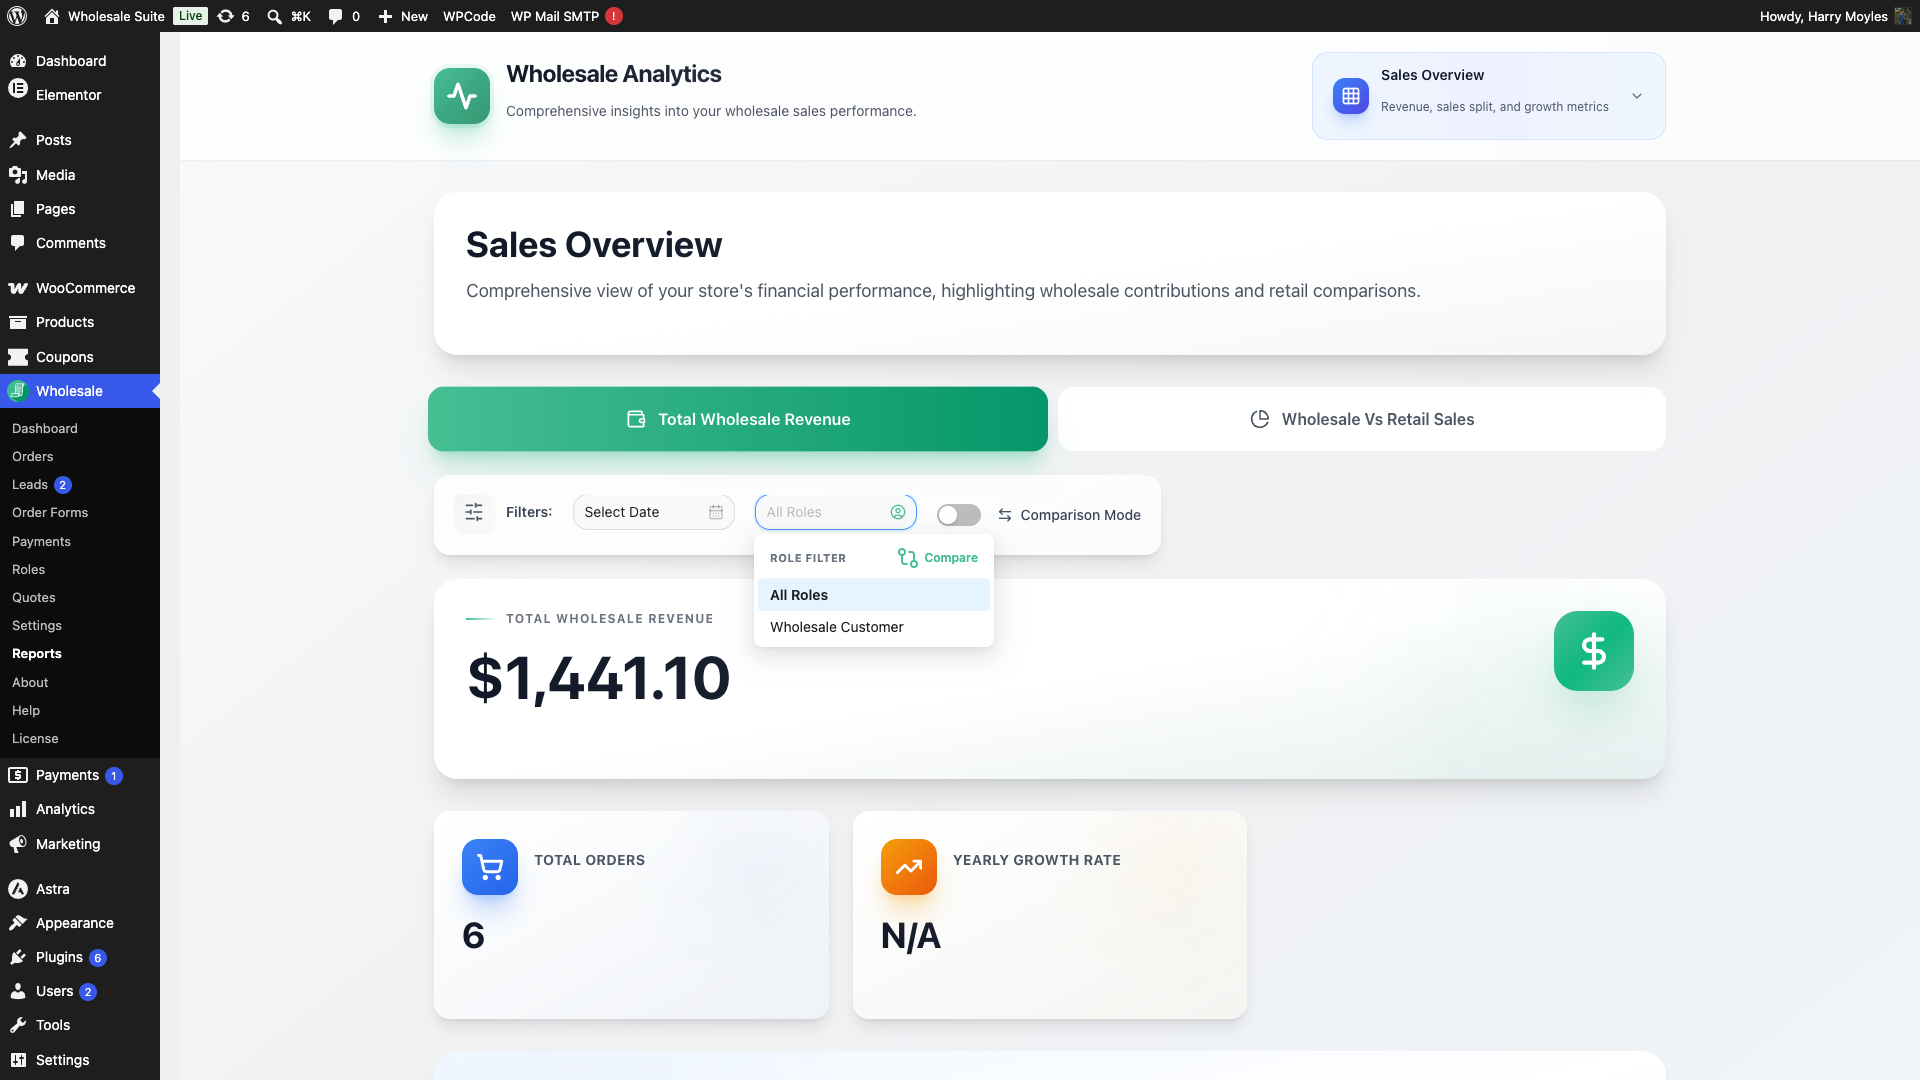
- Click the role dropdown in the filter bar. It shows All Roles until you narrow it, and opens under a Role Filter heading.
- In the dropdown header, click the Compare button.
- The dropdown switches to a Select roles to compare list. Click each role name you want to include. All selects every role and Clear deselects them.
- The selected roles appear as coloured pills under the filter bar and the dashboard cards update to show one column per role.
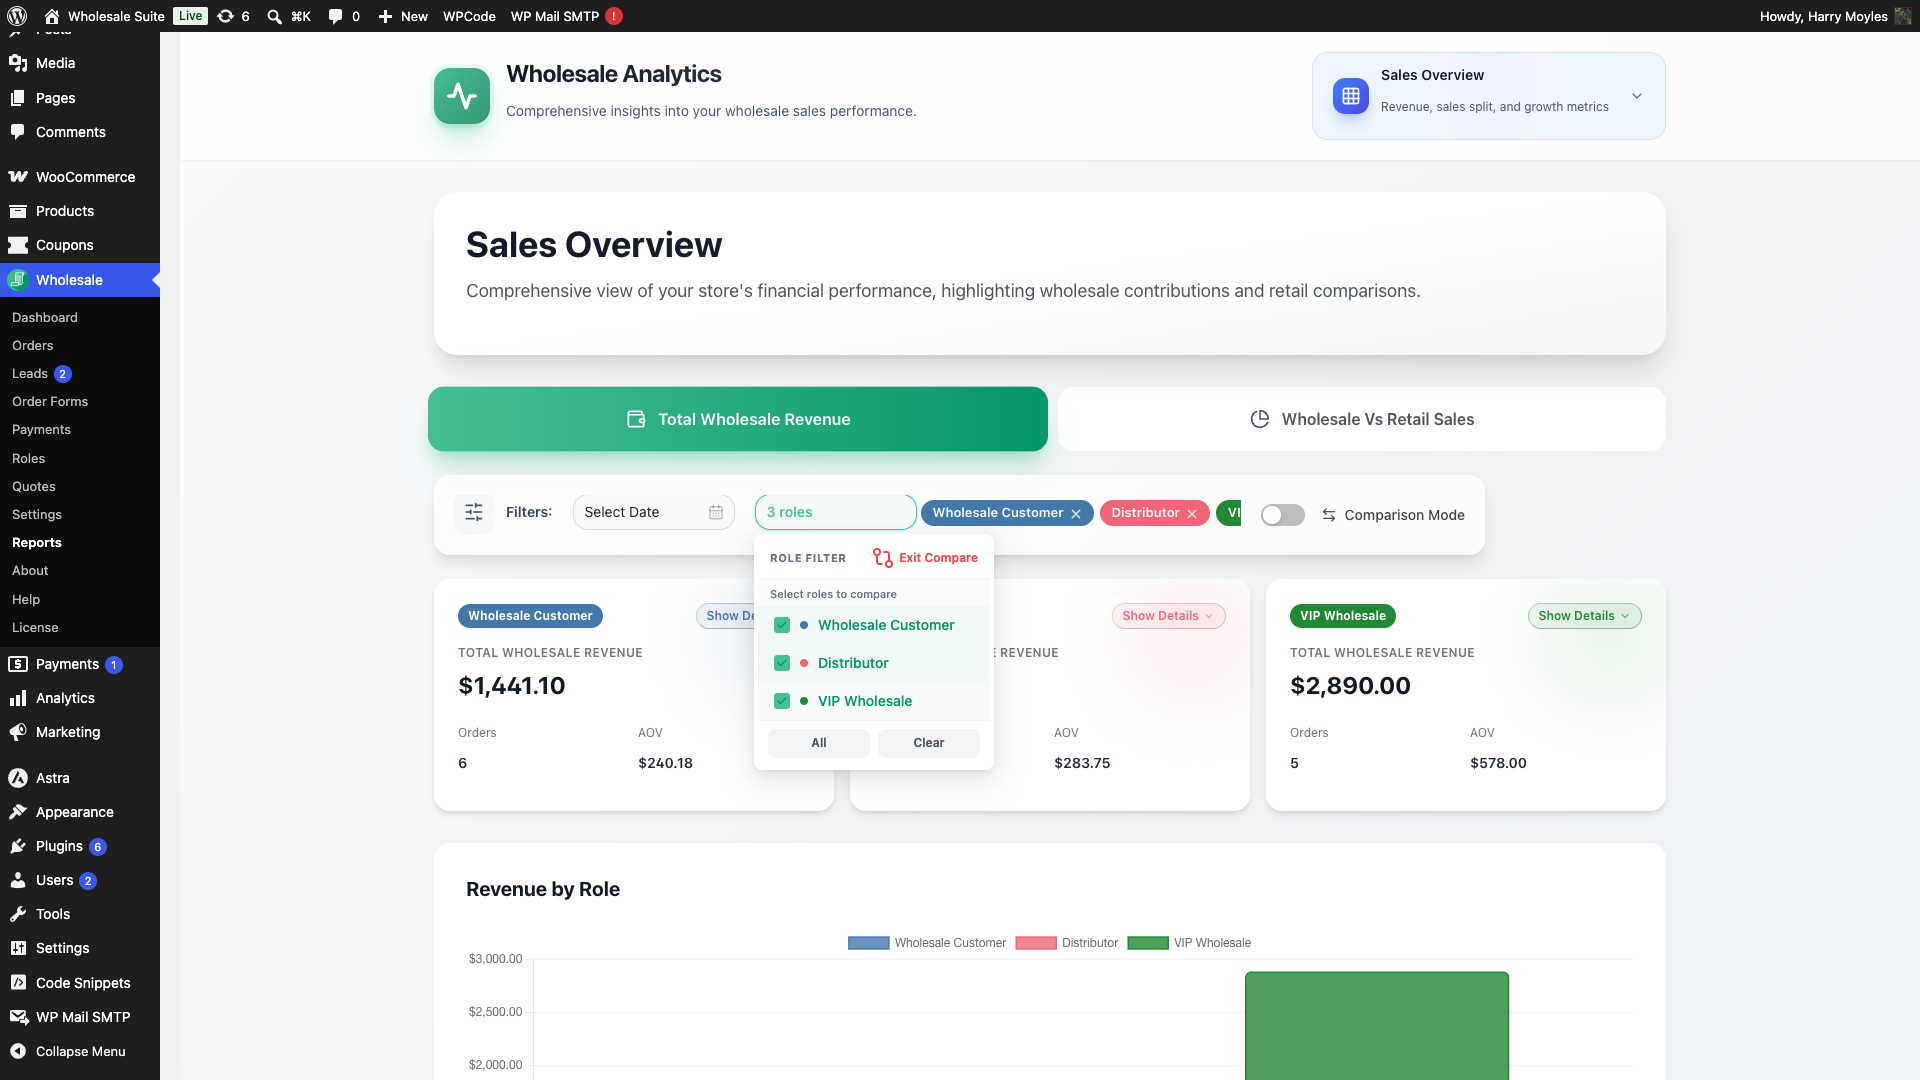
To leave Role Comparison, open the Role Filter dropdown again and click Exit Compare. The dashboard returns to single-role (or All Roles) view.
What you can compare
When Role Comparison is active, the following sections show one card column per selected role:
- Total Wholesale Revenue per role, including growth indicators and revenue difference between roles.
- Wholesale Vs Retail share per role so you can see which tier contributes the most to total wholesale revenue.
- Best Sellers By Volume and Best Sellers By Revenue per role, with each role’s top-selling products listed separately.
- Category Performance per role, showing how each tier spends across your catalogue.
- Top Products by Wholesale Volume and Top Products by Wholesale Revenue per role.
- Average Order Value per role, so you can quickly see which tier places larger orders.
- Unique Wholesale Customers per role, with new and returning customer counts split by tier.
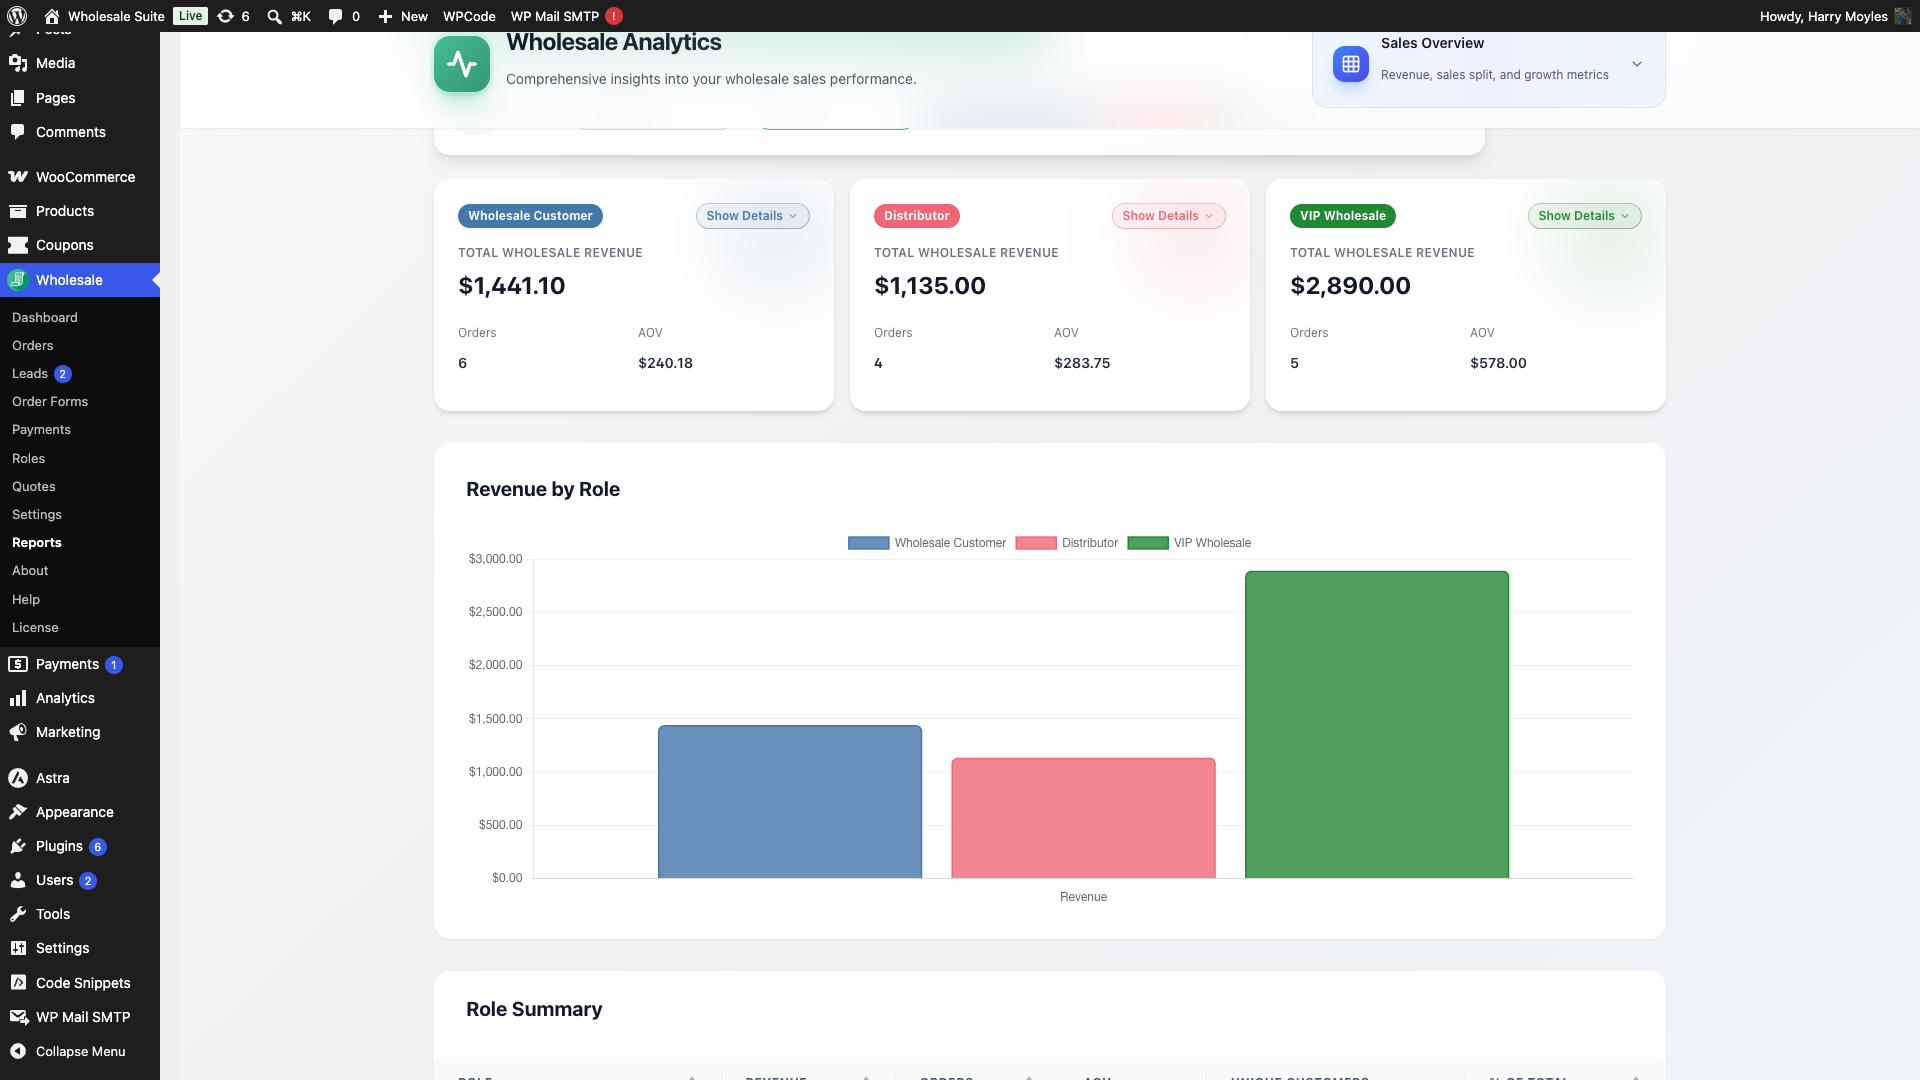
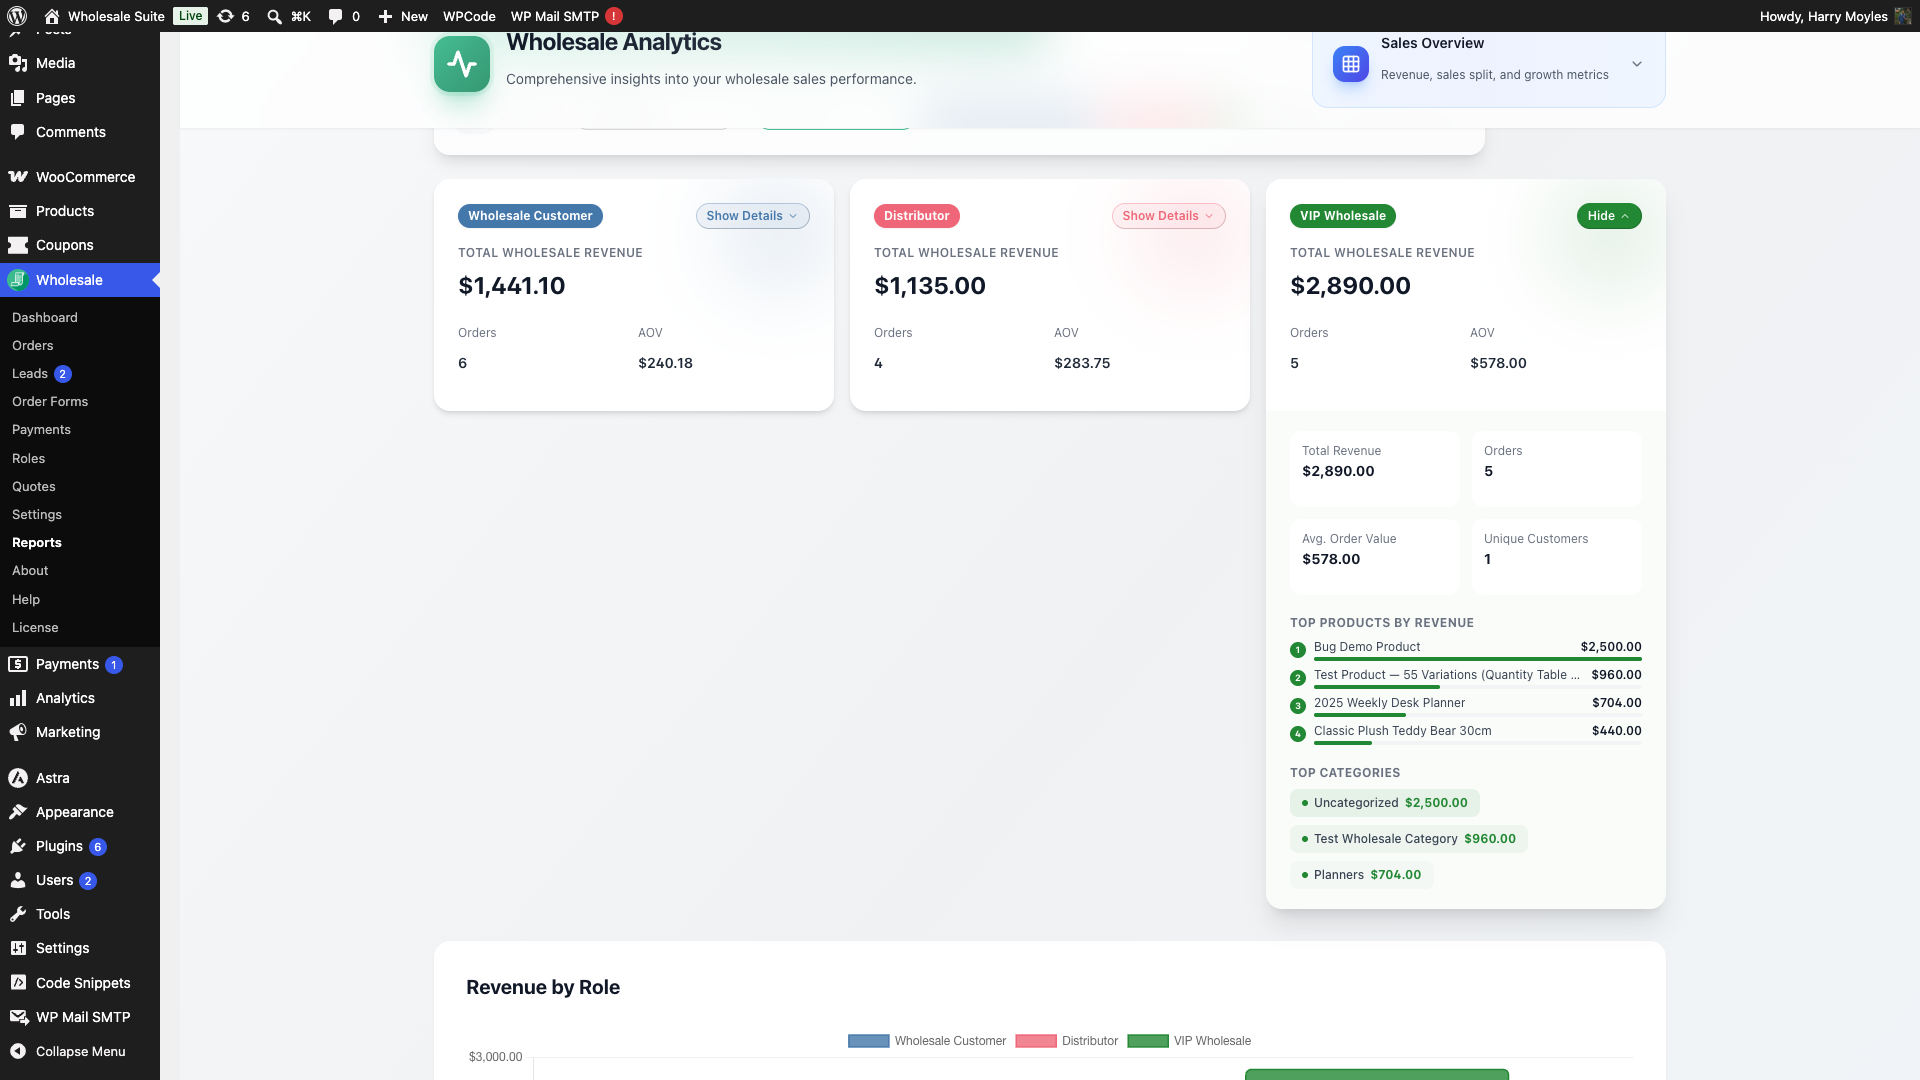
Each role card is expandable. Click a role card to drill into the per-role breakdown for that metric, including the top products driving the result. This is useful when one role is outperforming another and you want to see which products are responsible.
Comparing many roles at once can make charts harder to read. The dashboard shows a “Comparing many roles may reduce chart readability.” note if you select a large number of roles. For most stores, two to four roles is the sweet spot.
Sales Overview
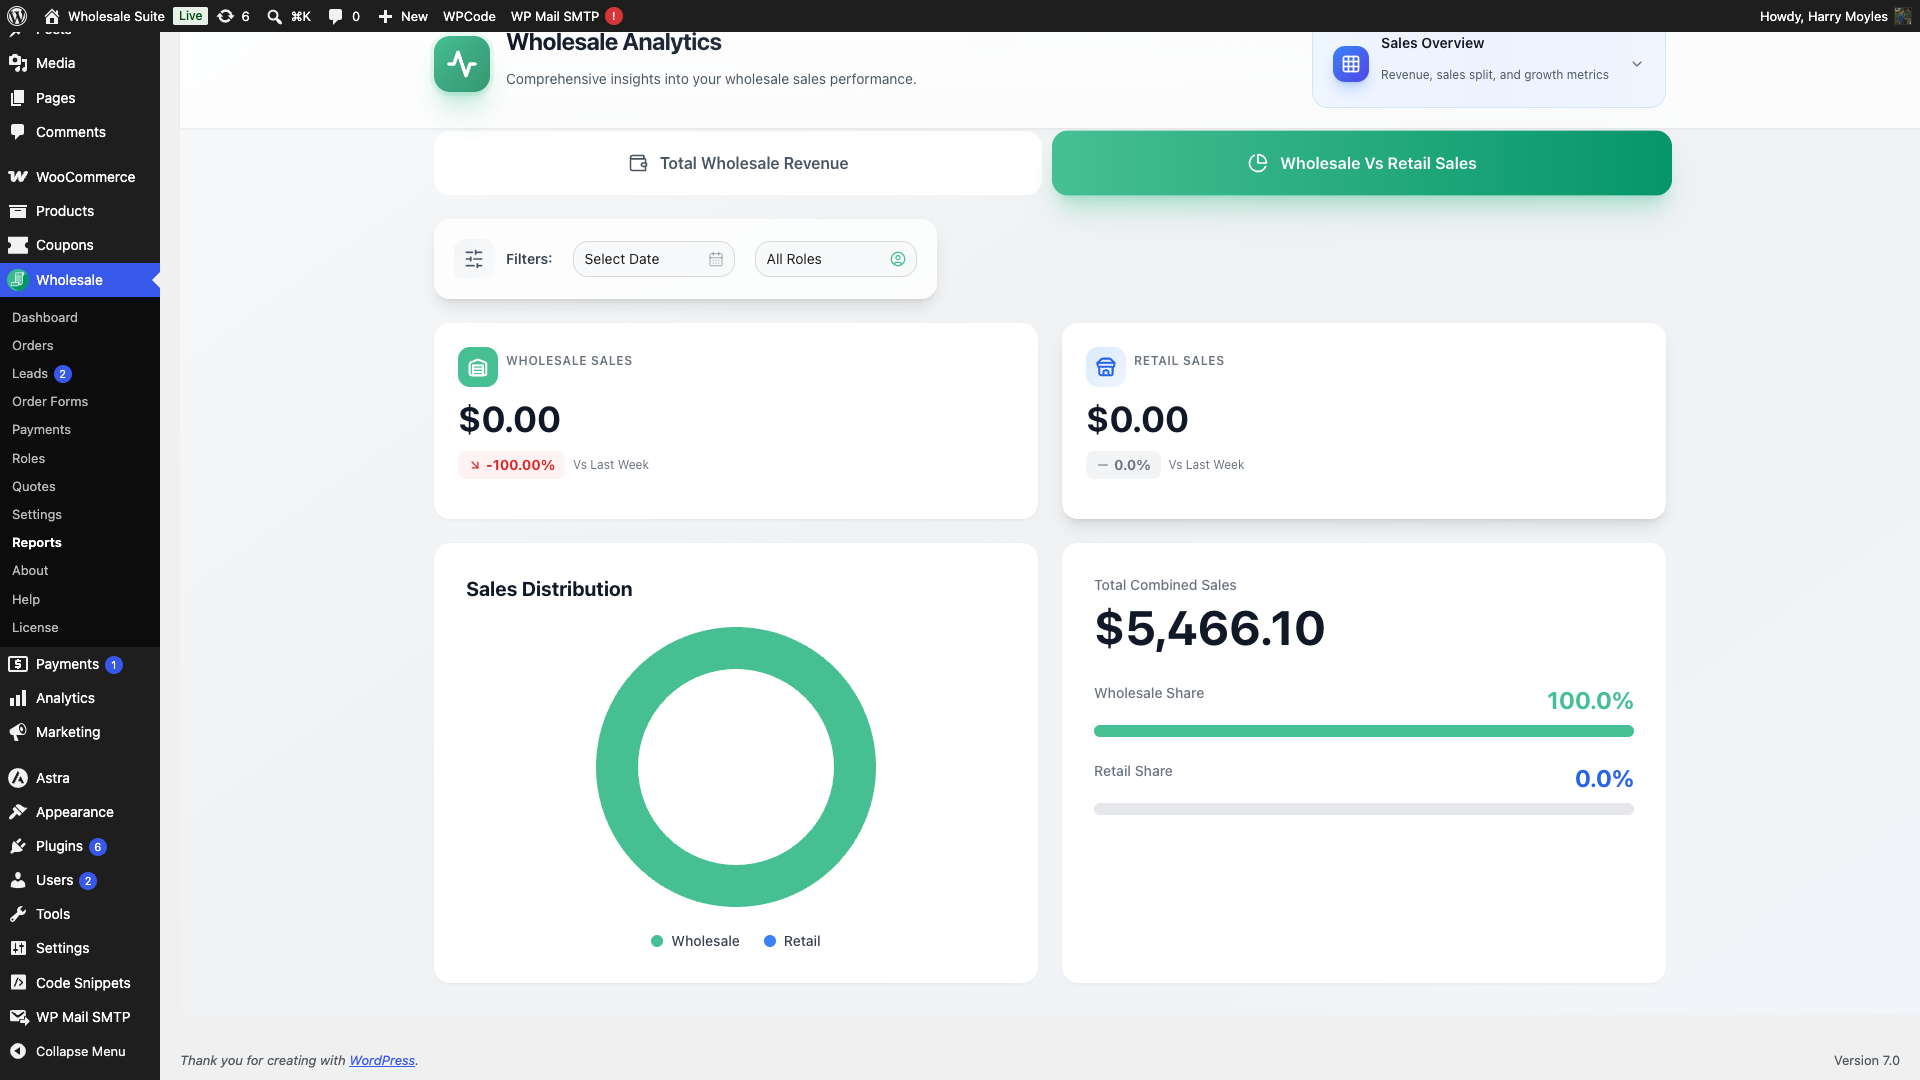
Sales Overview is your top-level financial dashboard. It has two sections: Total Wholesale Revenue and Wholesale Vs Retail Sales.
Total Wholesale Revenue
This section shows your cumulative wholesale revenue alongside key growth indicators: all-time growth percentage, weekly and yearly trends, and a summary of your highest and lowest sales from last week.
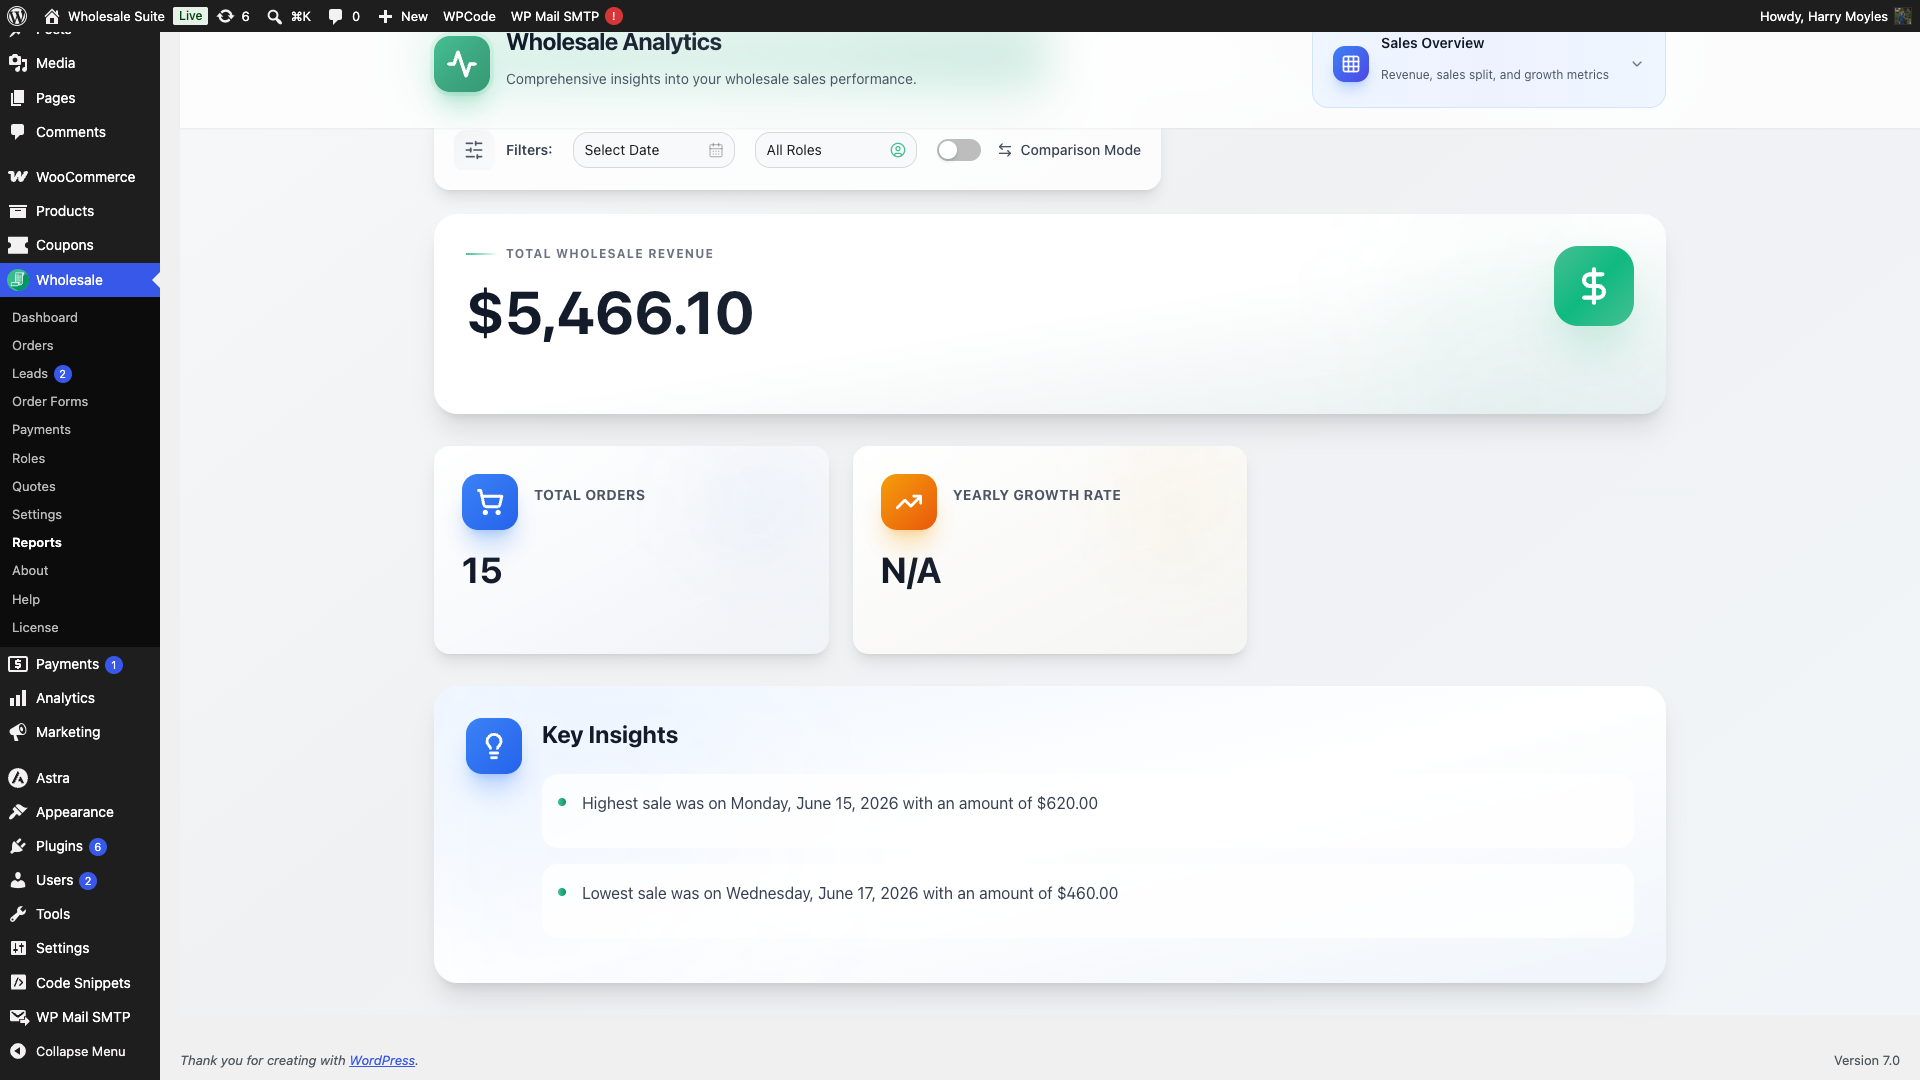
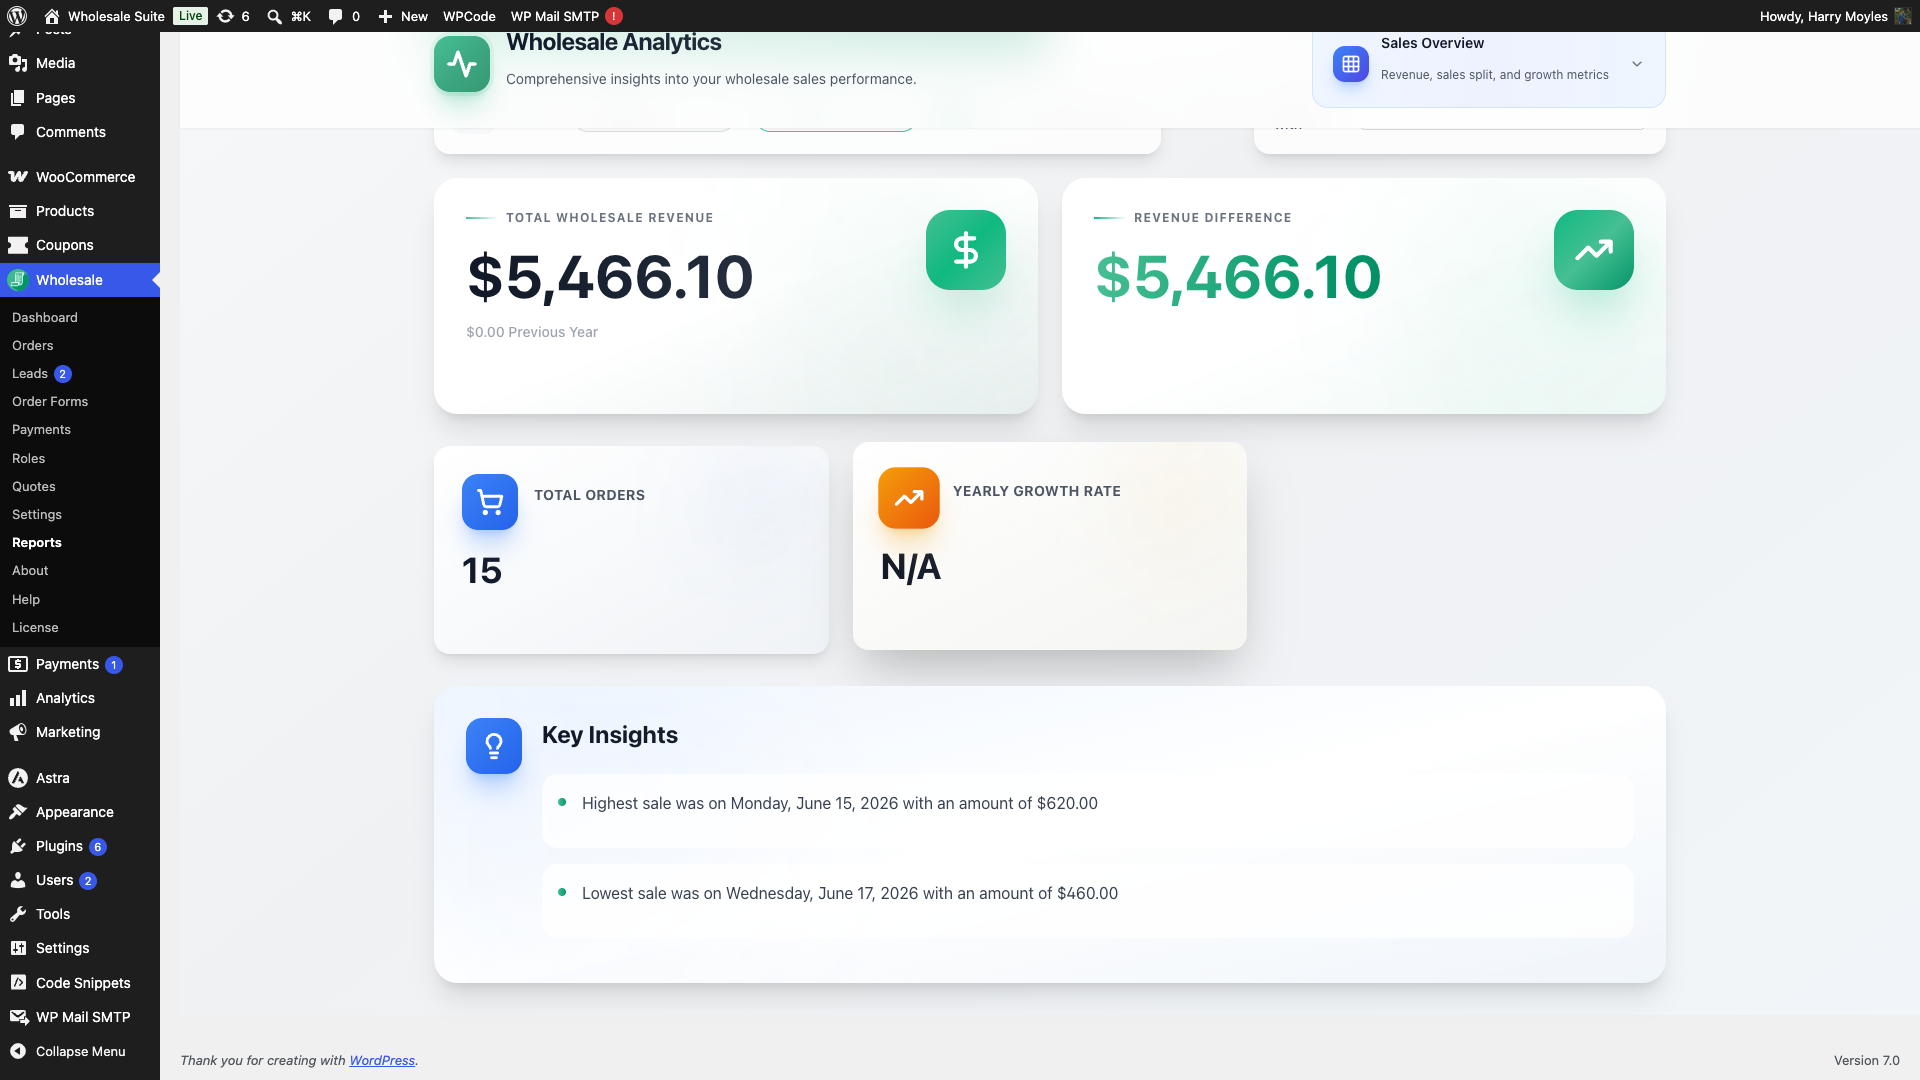
You can switch on Comparison Mode to see how the current period stacks up against a previous one. Choose between Previous Period, Same Period Last Year, or a Custom comparison range. When comparison mode is on, a second card appears alongside the current period so you can see the difference at a glance.
Wholesale Vs Retail Sales
This section breaks down how much of your store’s total revenue comes from wholesale customers versus retail customers. You’ll see individual cards for each channel (with weekly growth trends), a combined summary card, and a donut chart showing the split as a percentage.
Product Sales Overview
Product Sales Overview holds two sortable tables, Top Products by Wholesale Volume and Top Products by Wholesale Revenue. Only one shows at a time. Use the two buttons above the table to switch between them. Both help you identify which products your wholesale customers actually buy.
The two tables do not show the same columns.
- Top Products by Wholesale Volume: ID, Product, Total Units Sold, Total Revenue, Average Order Value, Number of Orders.
- Top Products by Wholesale Revenue: ID, Product, Total Revenue, Total Units Sold, Avg Unit Price, Number of Orders.
Average Order Value appears only in the volume table, and Avg Unit Price only in the revenue table. Click any column header to sort the list by that metric.
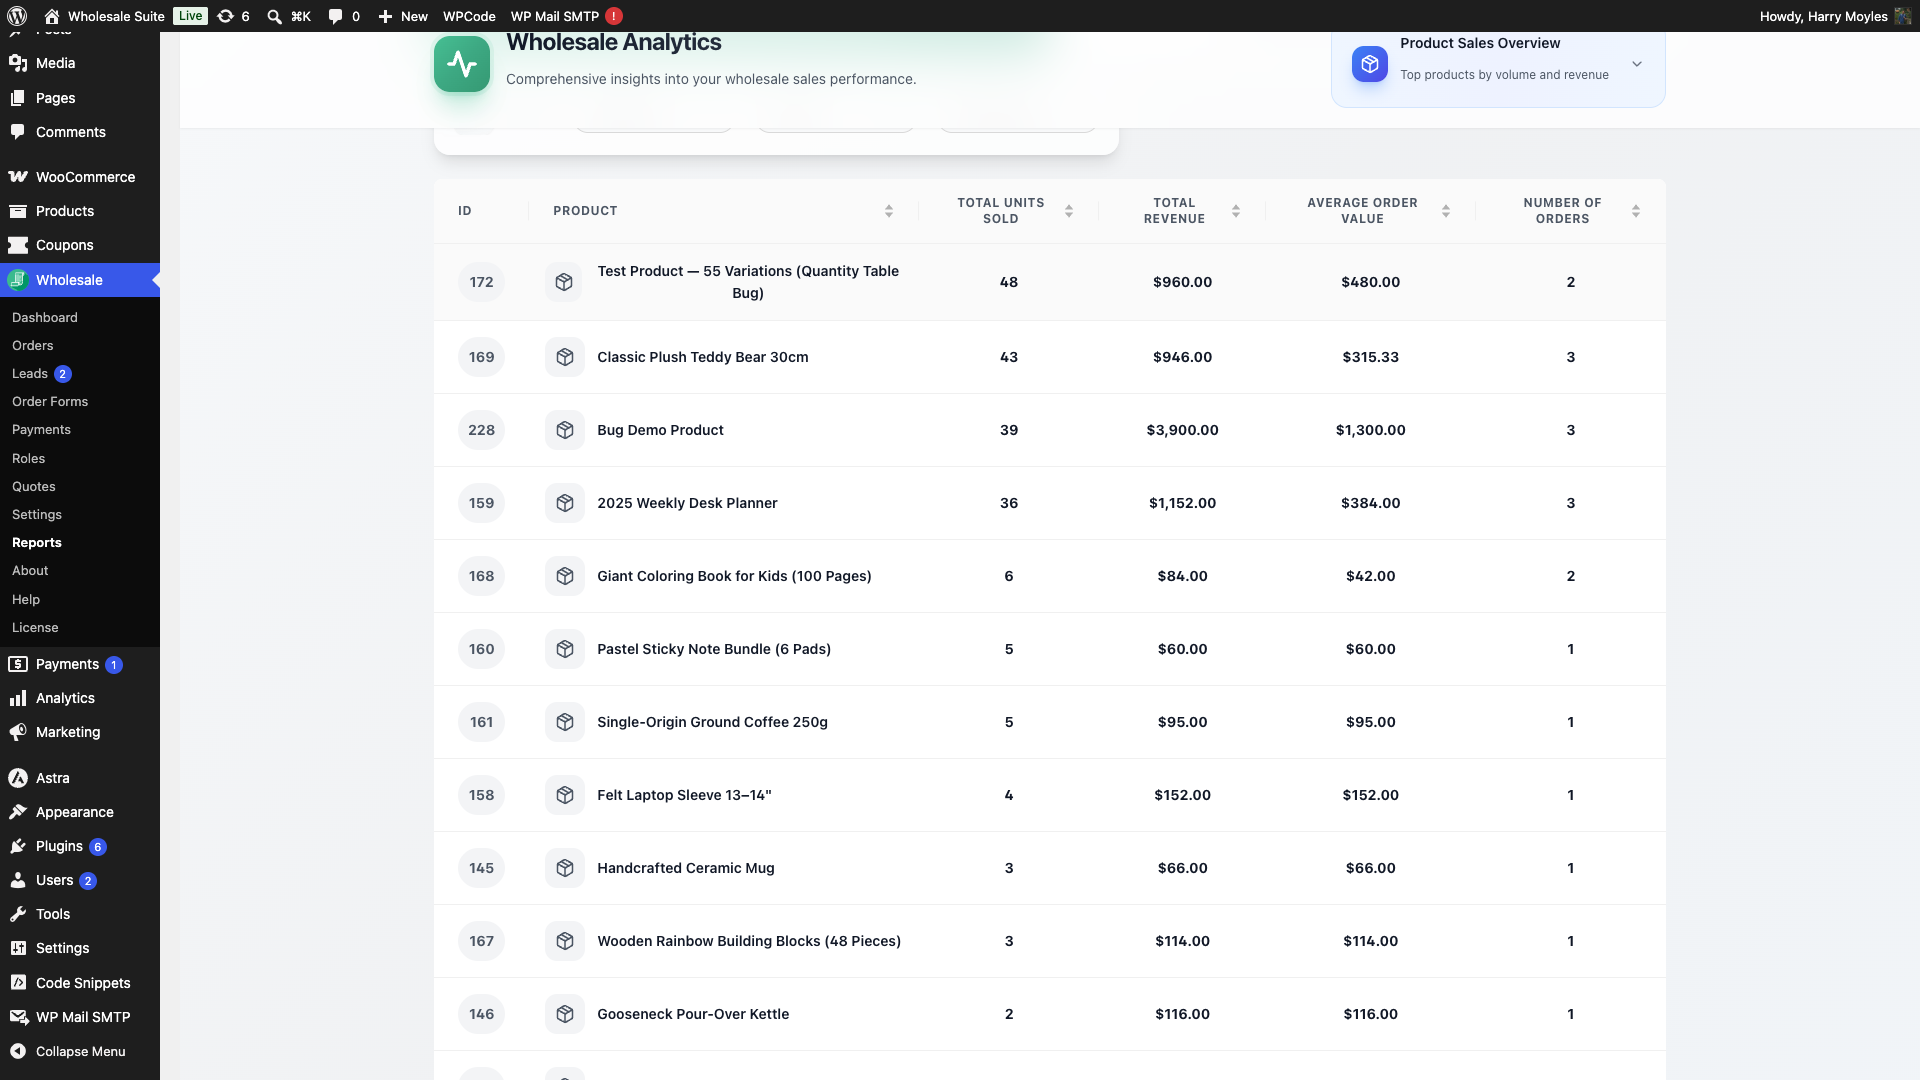
By default, the table shows 15 rows per page. Use the page size selector at the bottom to switch to 50 or 100 rows if you want to see more at once.
The Category filter at the top is particularly useful here. If you sell across multiple product lines, filter to a single category to focus your analysis.
Product Performance Analytics
This view visualises your best-selling products and category performance as charts rather than tables.
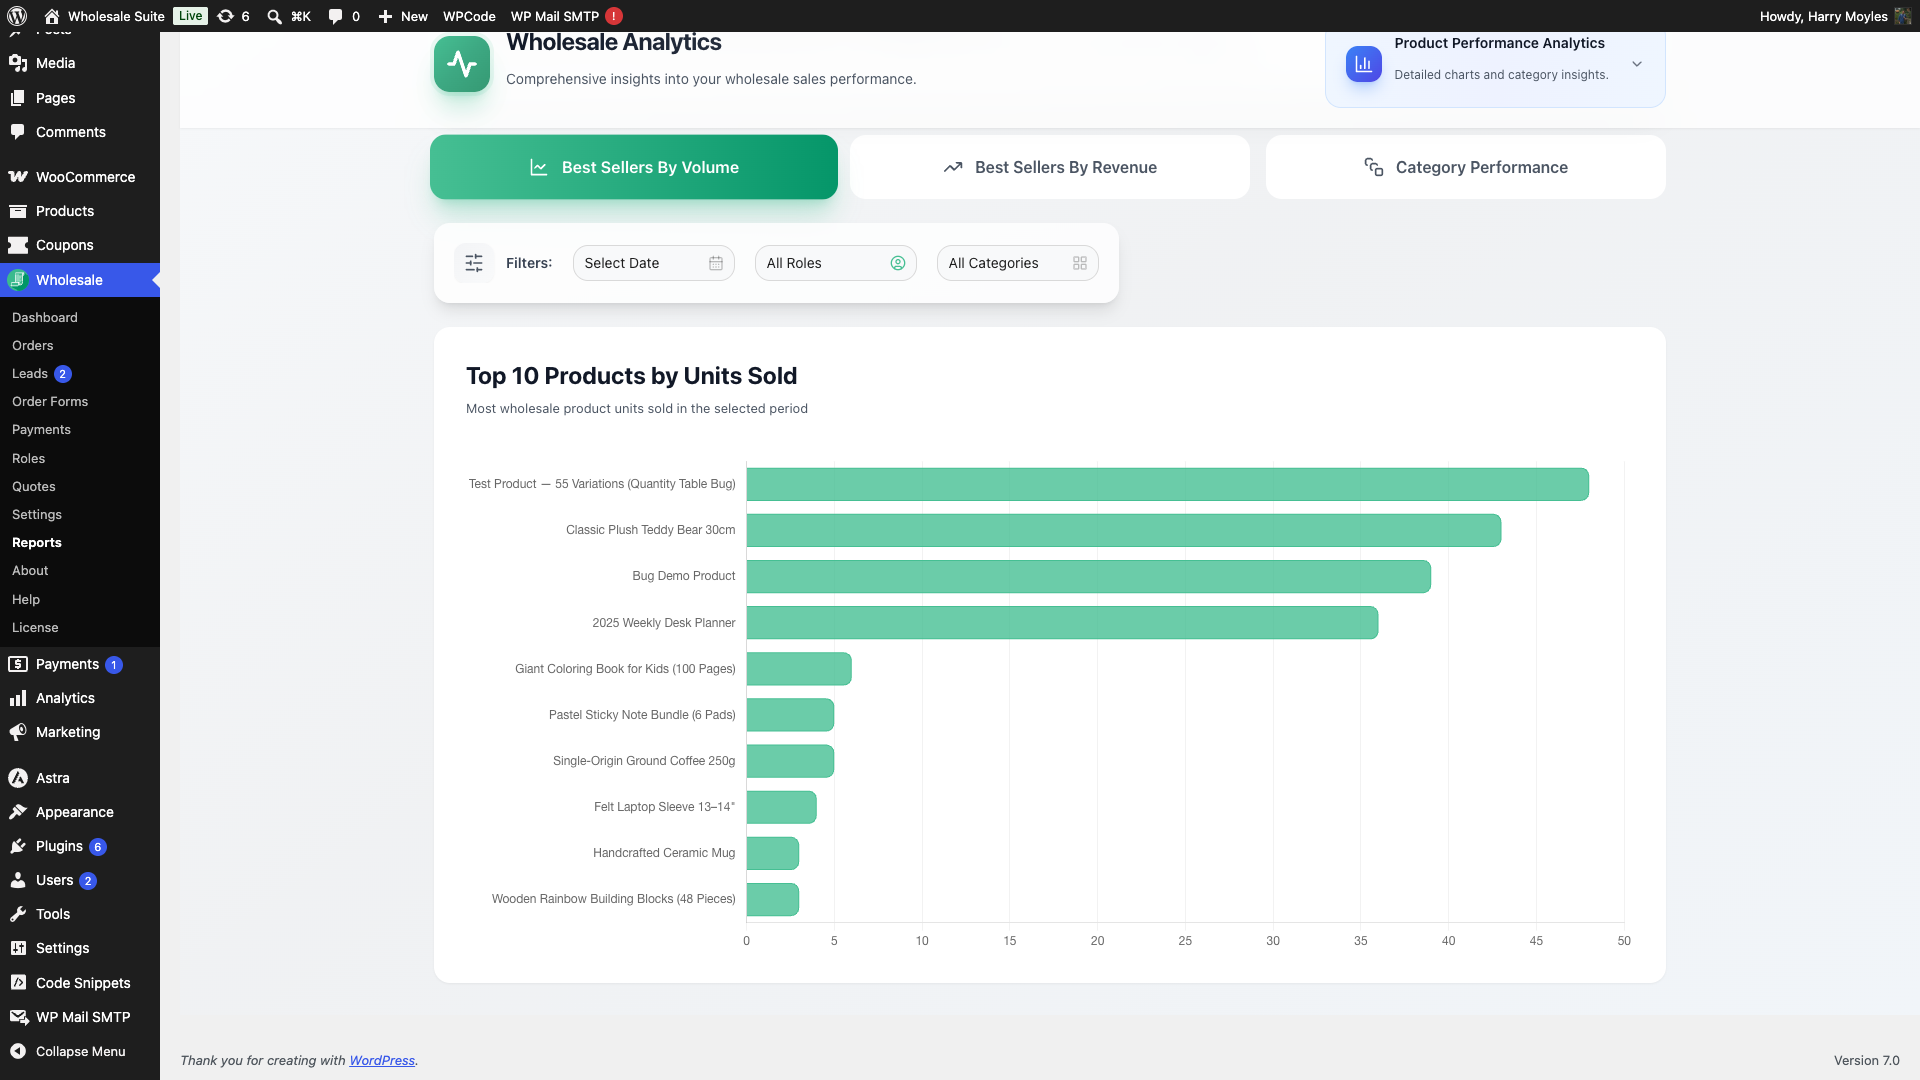
Best Sellers By Volume and By Revenue
Two horizontal bar charts show your top 10 products: one ranked by units sold and one ranked by revenue. The charts give you a quick visual sense of which products dominate and by how much.
Category Performance
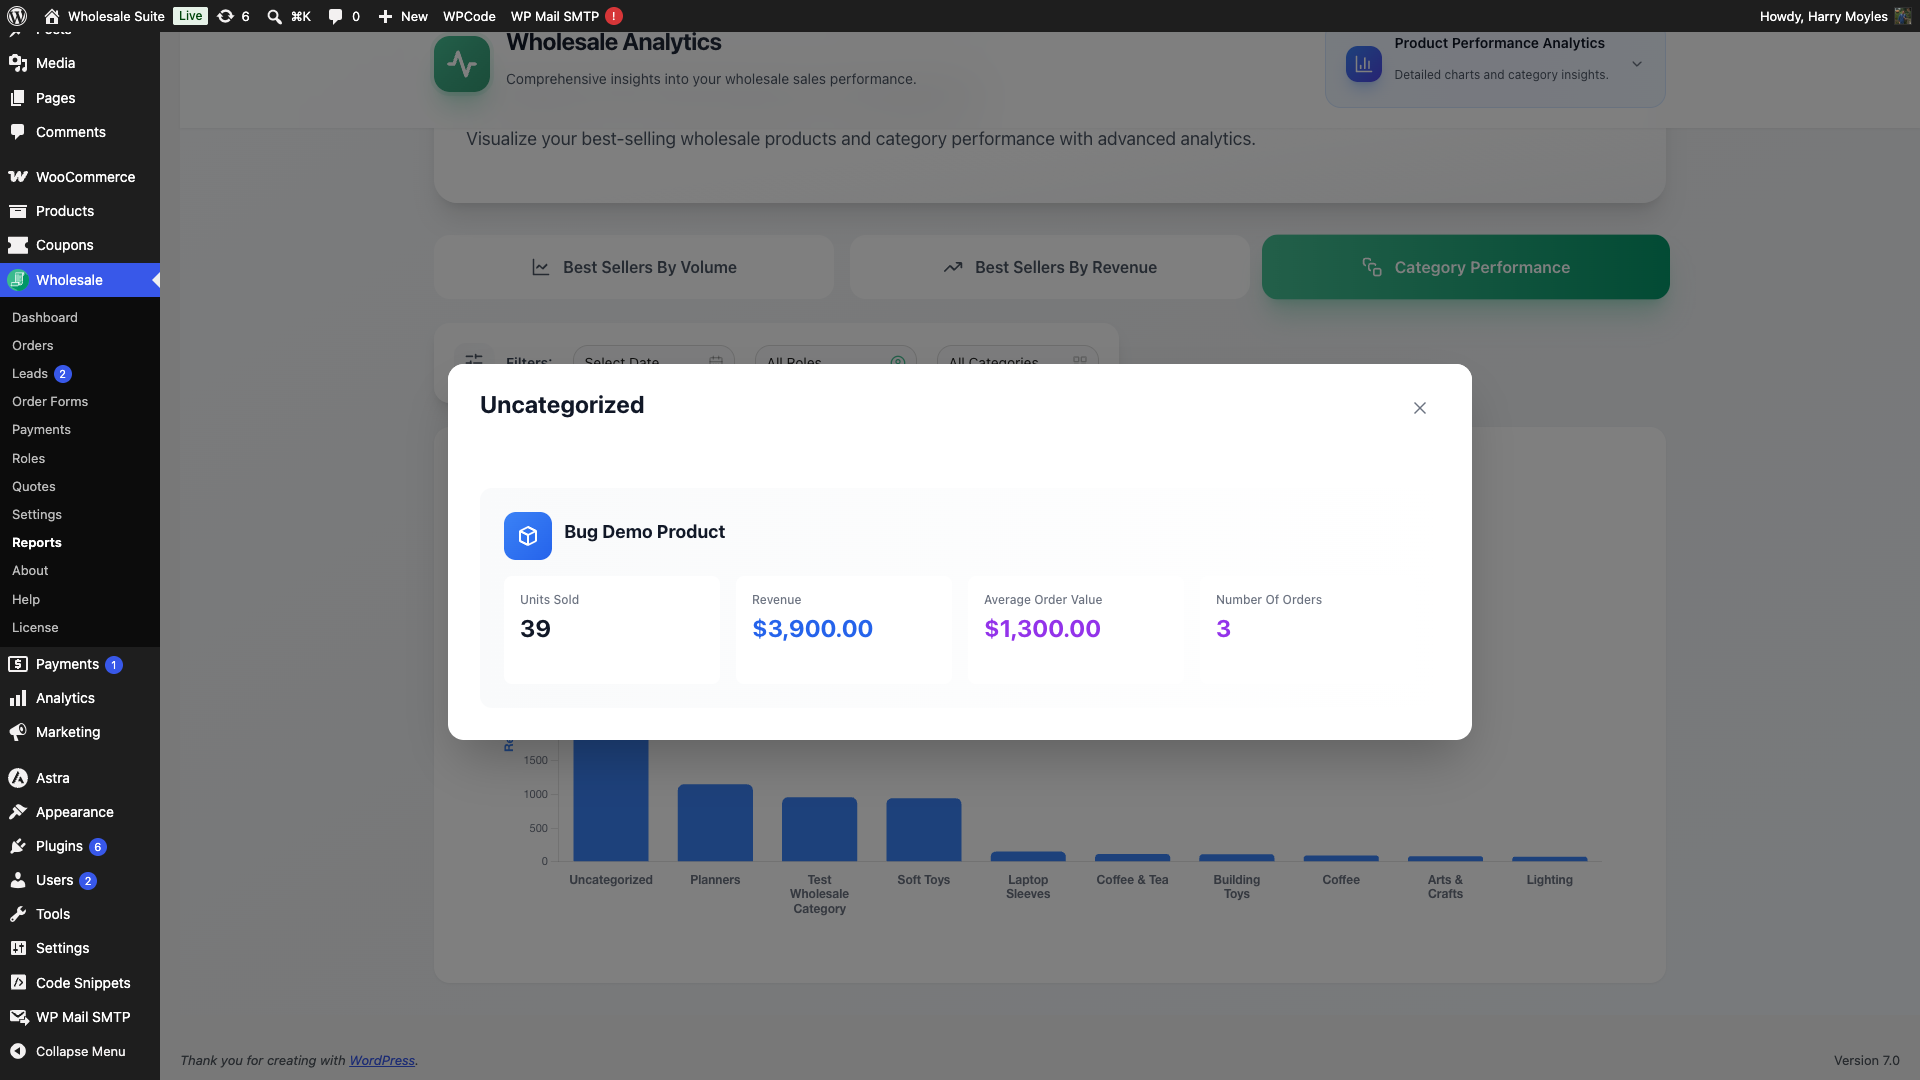
The Category Performance chart displays up to 10 product categories side by side. Each category has two bars, one for total units sold and one for total revenue, so you can compare volume and value across your catalogue at a glance.
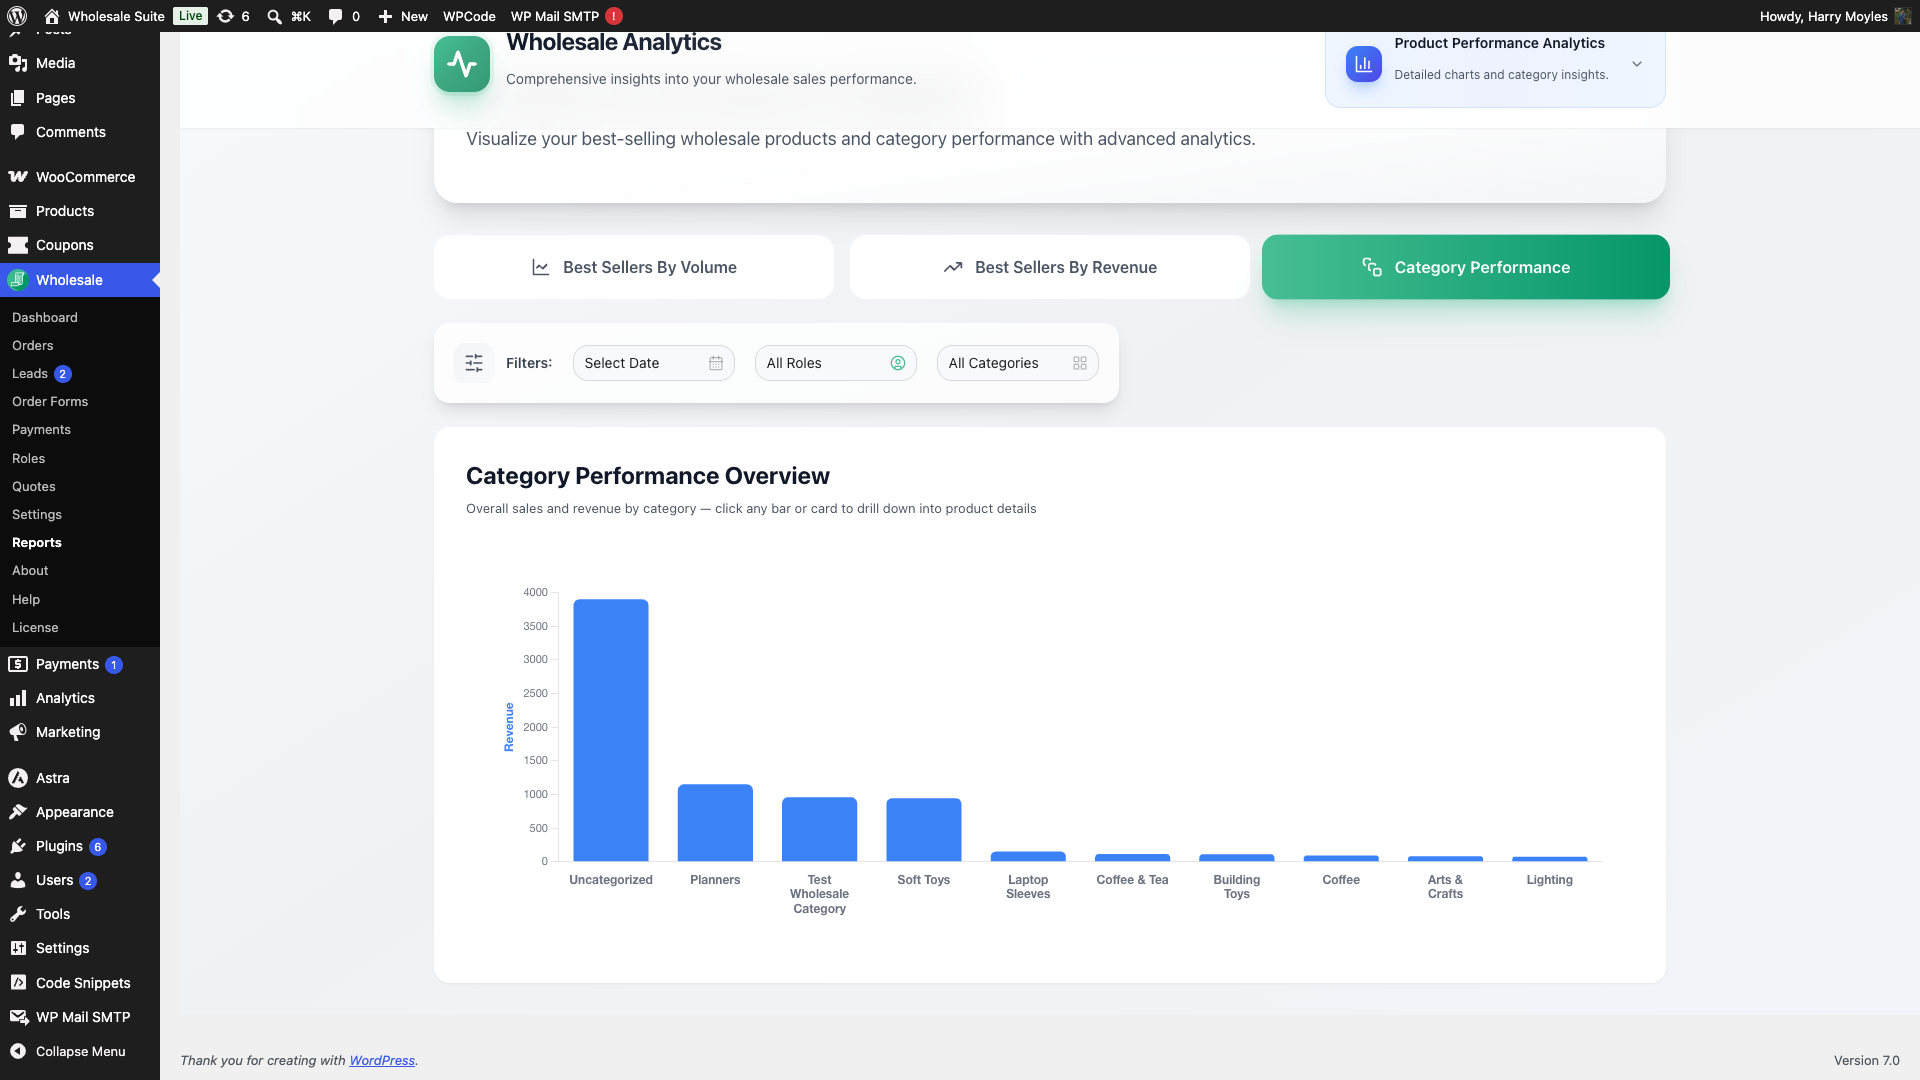
Click any bar (or any category card below the chart) to open a detailed breakdown of that category. The pop-up shows individual product cards within the category, each listing units sold, revenue, average order value, and number of orders.
Order Insights
Order Insights helps you understand average order value and how your wholesale customer base is growing over time.
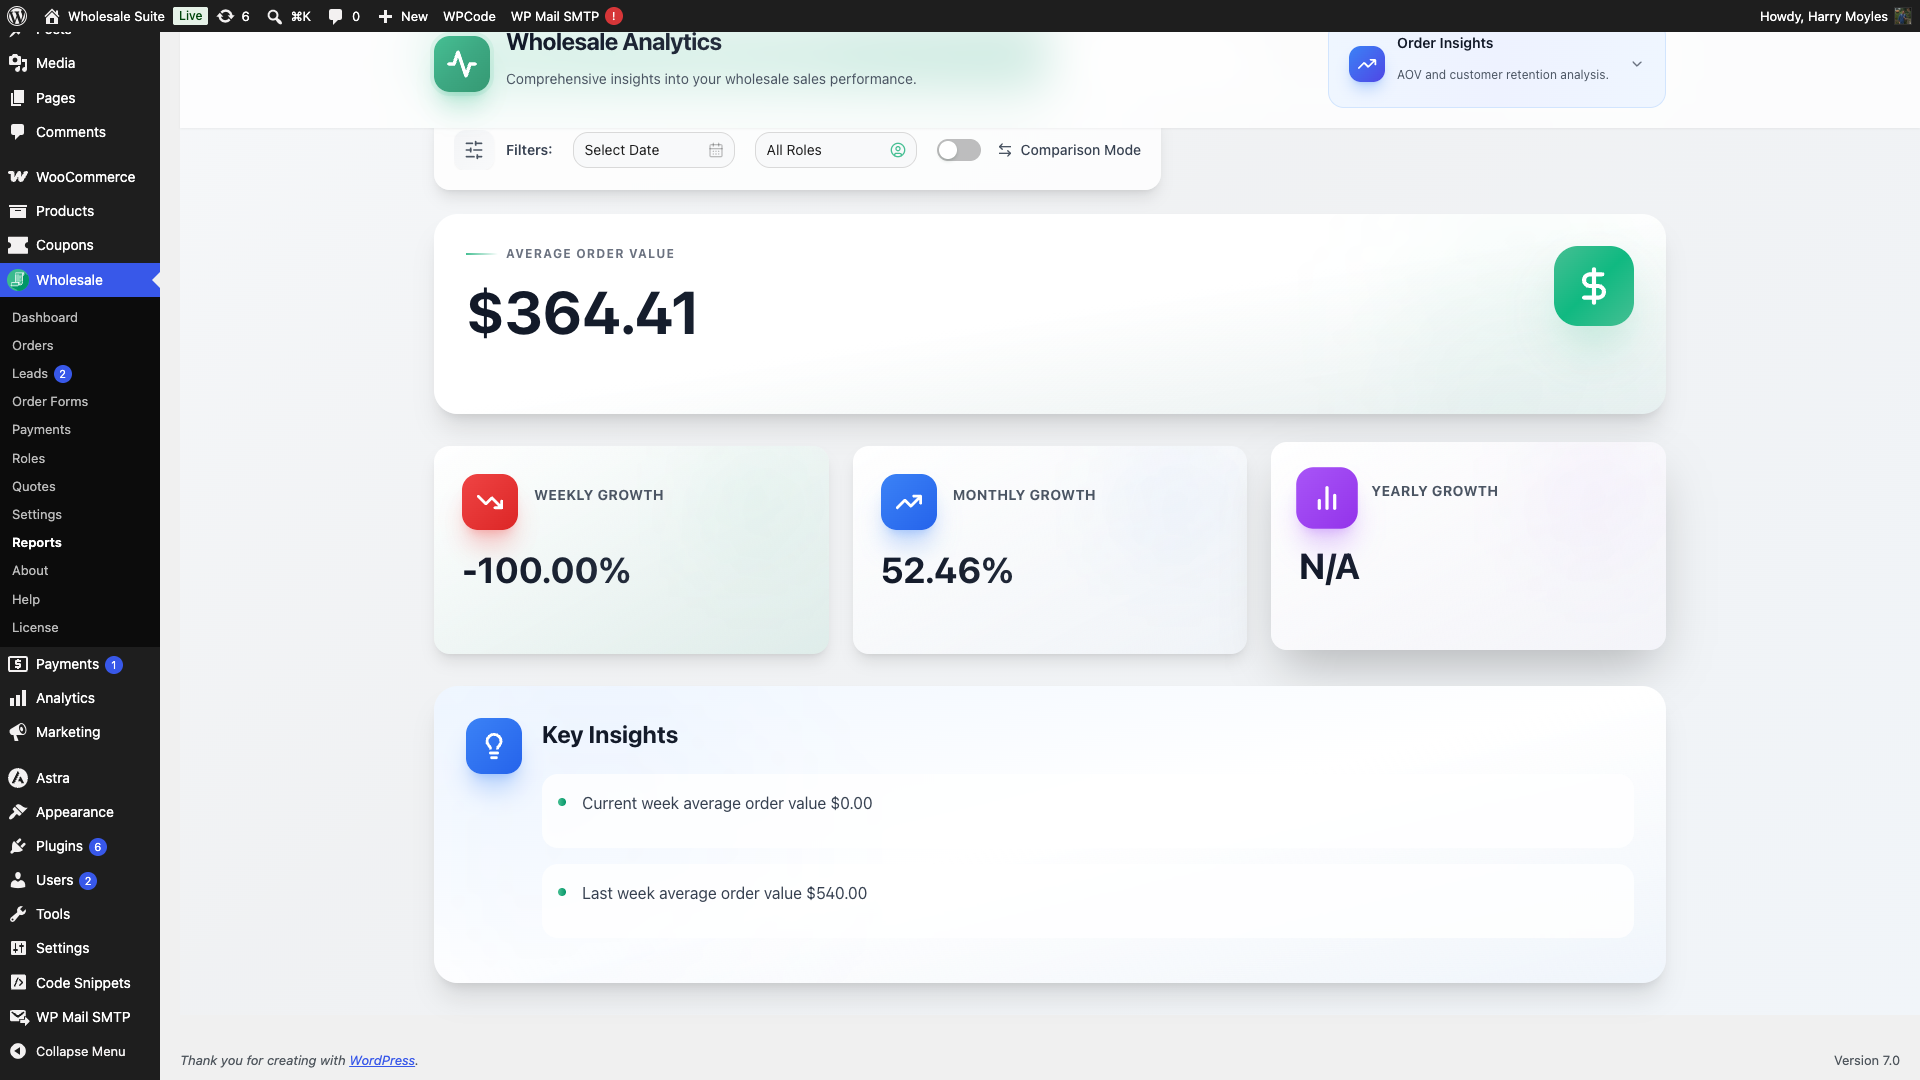
Average Order Value (AOV)
This section shows the average value of a wholesale order, along with growth rates broken down by week, month, and year. Use Comparison Mode here to see whether your AOV is trending up or down compared to a previous period.
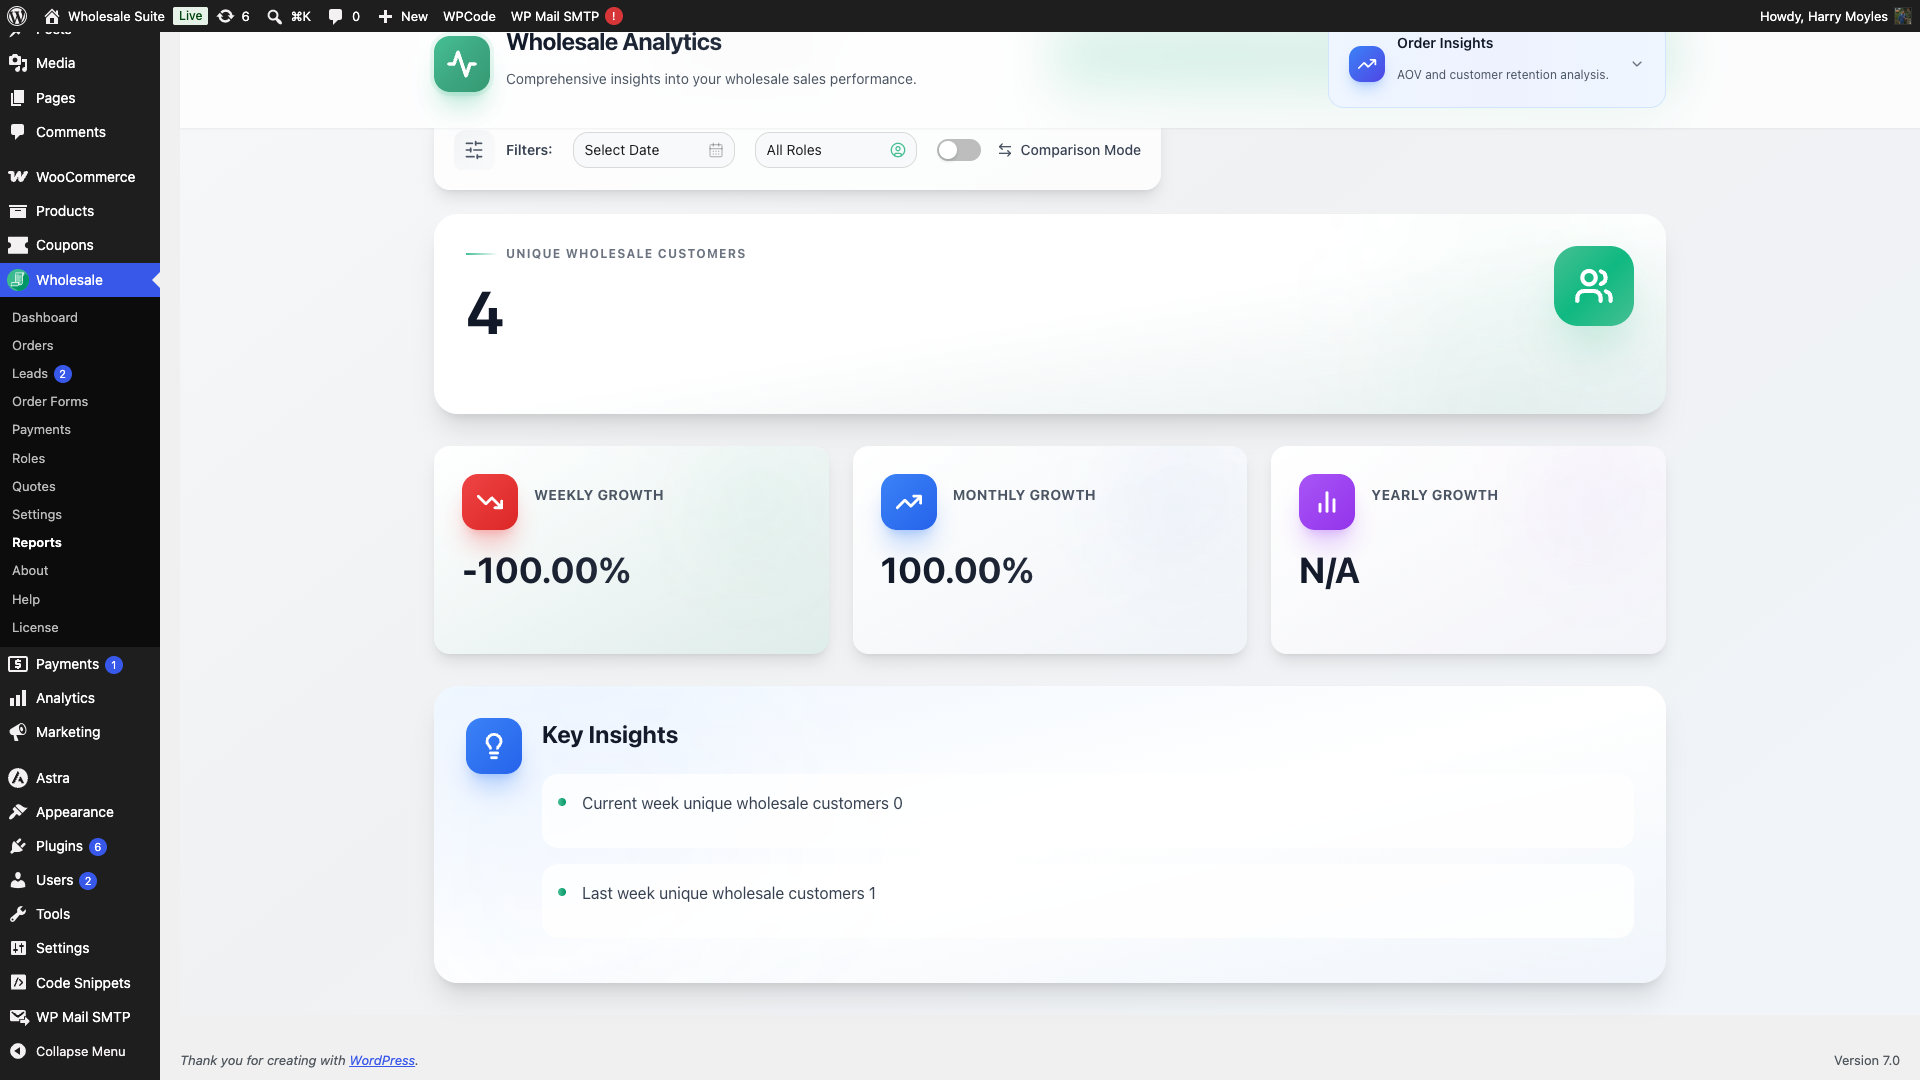
Unique Wholesale Customers
This section counts the distinct wholesale customers who have placed orders. The growth indicators work the same way as AOV: you can see week-over-week, month-over-month, and year-over-year changes, and enable Comparison Mode to benchmark against an earlier period.
Frequently asked questions
Why is the dashboard showing no data?
The dashboard only includes orders that are tagged as wholesale orders by Wholesale Suite. If your orders were created outside of the normal checkout flow (for example, manually created without the wholesale order workflow), they may not appear. Check that your wholesale customers are logging in with their wholesale account before placing orders.
Can I export the reports data?
The dashboard does not include a built-in export or download option. If you need to export data for external analysis, you can use WooCommerce’s built-in orders export or a third-party export plugin.
Who can access the Reports page?
Reports needs WooCommerce management permissions, which is the manage_woocommerce capability. The Shop Manager and Administrator roles both hold it, and a custom role can hold it too. If a team member cannot see the Reports menu, check that their role has that capability.
Can I compare more than two wholesale roles at once?
Yes. Role Comparison supports as many roles as you have configured, but selecting a large number can make the charts harder to read. The dashboard shows a readability note when you exceed the comfortable range. Two to four roles usually gives the clearest picture.
Need help?
If you have a question or run into any issues, we’re here to help.
- Premium users: Open a support ticket
- Free users: Visit our community forum