If businesses learned anything over the past few years, it’s that nothing is certain. Customers change their minds. Supply chains disappear. Every time you disappoint a customer with an out-of-stock item, you’re leaving money on the table. So, how can you avoid stock-out while also not tying up business cash in your warehouse? Inventory forecasting provides an answer to better planning and having the items in stock that your customers want.
Are you unfamiliar with the concept of inventory forecasting? Don’t worry, we’ll explain how to leverage inventory forecasting for your company.
What Is Inventory Forecasting?
Inventory forecasting predicts what stock levels you’ll need to meet future demand. It also accounts for contingencies such as safety stock and lead times. It uses historical data and market trends to establish an inventory baseline.
Businesses can use spreadsheets to calculate important forecasting metrics. These days, it’s much easier to use inventory forecasting software that uses predictive modeling and algorithms. These tools allow you to have evolving forecasts that become more accurate over time.
Inventory Forecasting vs Replenishment
Inventory forecasting and stock replenishment are sometimes confused as the same concept. Both are critical to effective inventory management but are different sides of the same coin.
Inventory forecasting predicts what inventory you need to fulfill future customer demand. It is part of the larger demand planning process and also involves sales forecasting.
Replenishment meets demand forecasts. It accounts for lead times, safety stock, and reorder points (ROPS). Once you have a sales forecast, a replenishment strategy ensures you meet demand and avoid any stock-outs.
The Benefits of Accurate Inventory Forecasting
It takes a lot of data and a lot of effort to implement accurate inventory forecasting. So why bother? Reliable forecasting comes with a boatload of benefits.
- Plan for future demand– it’s best to be prepared for future demand. Forecasting can account for market fluctuations and seasonal trends, ensuring you keep up with the competition.
- Maintain optimal stock levels– streamline stock control. You keep your warehouse in the “Goldilocks” zone, having not too much or too little, but just the right amount of inventory.
- Reduce inventory costs– optimal stock levels help you avoid wastage of perishable goods. You also reduce your warehouse footprint, only paying for the space you need.
- Streamline inventory management– automate ROPs and optimize stockouts with less effort. You reduce the need for manual and repetitive processes.
- Increase productivity– your team will spend less time on poor-selling items and focus more effort on products that sell.
- Gain business insights– inform other departments such as sales, customer service, and accounting.
- Improve the customer experience– have the hot items and necessities ready to ship. Customers can find the products they want in your e-commerce and brick-and-mortar stores.
How Does Inventory Forecasting Affect Customer Satisfaction?
Every business knows that customer satisfaction (CSAT) keeps them in business. Sure, you may have products they want or need, but what else are you doing to set yourself apart?
Every interaction from checkout to customer support makes up the overall brand experience. When a user visits your out-of-stock product pages, they leave the experience disappointed.

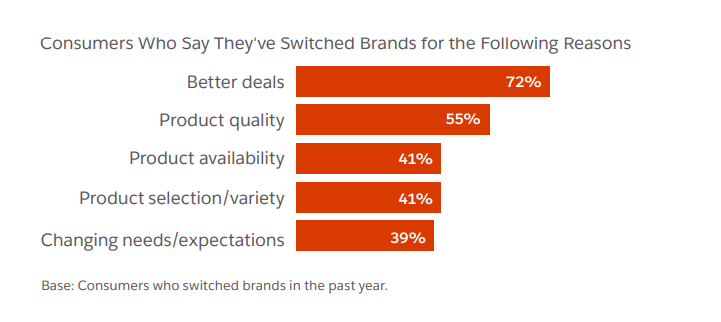
Not only that, but a recent Salesforce report found that 41% of customers will switch brands due to product availability or a lack of selection. That means every stock out you fuel can potentially turn away more than four out of ten customers for good.
Shoppers visit your store when it’s convenient for them. Keep them happy by having the products they love in stock and available every time for a better customer experience. Demand can spike unexpectedly. Good inventory forecasting ensures you have already reordered. You’ll also minimize wait times for pre-ordered items.
Positive experiences make customers 3.5 times more likely to purchase from you again.
What Are the Four Types of Inventory Forecasting Methods?
There are many approaches to forecasting demand and optimal stock levels. Each one has its pros and cons but you’ll likely end up using a combination of two or more methods.
Let’s take a look at the four main inventory forecasting types.
1. Trend forecasting
Trend forecasting relies on historical data that maps out the typical demand for a product. It is good at forecasting products that have been around for a few years or more. You look at previous sales history and identify demand spikes and wanes.
Trend forecasting is commonly used by retail and e-commerce businesses because of its simplicity. Each product’s previous demand history establishes its baseline for future sales predictions. For instance, a dip in winter coat sales in March applies to the upcoming season.
Trend-based forecasting works with both long-term and seasonal forecasting. Long-term focuses on macro trends such as gradually increasing customer demand over time. It requires larger sets of historical data.
Seasonal forecasting looks at the next 3-6 months based on the same season in previous years.
2. Quantitative forecasting
Quantitative forecasting uses numerical data and hard evidence. It only works with larger sample sizes and requires considerable statistical analysis. When fed enough data, quantitative predictions have moving averages that are highly accurate.
Quantitative forecasting relies on time-series analysis, exponential smoothing, and regression analysis. Several types of machine learning models and AI facilitate precise, evolving models.
Quantitative inventory data includes:
- Historical sales
- Past orders
- Inventory levels
- Lead times
- Customer demographics
- Promotional sales
- Seasonal sales
- Market performance
- Competitor analysis
3. Qualitative forecasting
Qualitative forecasting relies on the part of the sales process that isn’t easy to quantify. It is a proven forecasting method when you lack a large amount of historical data. Qualitative forecasting is the preferred option for startups and brand overhauls.
Qualitative data includes customer preferences and opinions on products and services. You gather data through research methods such as focus groups, surveys, feedback forms, and other market research.
Categorize data and look for patterns and trends to aid inventory forecasting. Gather subjective data from industry leaders and specialists. Combine the expert opinions with those of your target audience to predict optimal stock levels.
4. Graphical Forecasting
Graphical forecasting is a method that uses visualization to gain demand planning insights. Instead of only looking at calculating averages and other metrics, data is depicted in graphs and charts.
A graphical approach enables you to dig deeper and notice hidden patterns. You can use both qualitative and quantitative data. Forecasting tools help you visualize the data in a variety of formats.
Inventory forecasting graphs update in real-time. They are easily shared with managers and key decision-makers. With inventory management software, it’s easy to turn data into graphical forecasts.
How To Leverage Inventory Forecasting To Increase Customer Satisfaction
Alright, so you understand the basics of forecasting and planning for demand. How can you get the most out of your efforts and enhance the customer experience?
1. Choose the right data and approach
Making predictions about the market is never a sure thing. You’ve rotating stock, introducing new products, and winding down other lines. Successful forecasting starts with picking the right strategy.
What inventory forecasting method is best for you depends on what data is available. Are you launching a new product or just the newest model?
With new products, you can use historical data from other new product launches or products in the same category. Alternatively, you can turn to customer surveys and focus groups to anticipate demand.
What about if you don’t have any historical data? Then a qualitative approach with heavy market research is the only way to go.
You will likely have high volumes of historical data. Implement a data warehousing strategy based on Apache Hive architecture or something similar to manage data handling and storage.
2. Plan for seasonality with comparable time periods
Basic forecasting calculations will give you averages like daily sales over a period of time. However, these numbers are often a reflection of the bigger picture. Regardless of what products you sell, there is almost always some seasonality with retail or wholesale orders.
Dig deep and look for hidden patterns that reflect changes in demand due to anything including:
- Weather
- Holidays
- Cultural norms
- School schedules
- Tourism
3. Avoid stockouts by tracking forecasting metrics
Of course, inventory forecasting predicts how much inventory you need to stock. However, how accurate your predictions are depends on what type of metrics you plug in.
Here are some vital inventory metrics to consider when planning for demand forecasting:
Lead time
The amount of time it takes for new products to arrive in stock. This includes manufacturing, shipping, and processing time. For online merchants, this can also include the time it takes to get from the warehouse to the customer. The average lead time is essential to calculating your reorder points.
Lead time = Order processing time + Production lead time + Delivery lead time
Average sales
The amount of sales per month, quarter, and year. It gives a useful if oversimplified baseline for inventory forecasting. You’ll get a more accurate forecast if you account for stockouts. For example, if an item was out of stock 50% of the time, that means it likely would have sold twice as much had it been in stock.
Average sales = total number of sales last year / total number of days in stock last year
Lead time demand
The number of products you need to avoid running out of stock while meeting demand.
Lead time = Average lead time in days x Average sales per day
Safety stock
The amount of stock you need to cover predicted spikes in demand.
Safety stock = Maximum daily sales x Longest lead time (days) – Lead time demand
For example, the amount you five bicycle helmets per day on average but one day last year you sold 25 in one day. Due to lead times, you ended up out of stock for 5 days. The average lead time is 3 days so we get a lead time demand of 15 helmets.
That gives us 25 x 5 – 15 = 110 helmets of safety stock.
- Reorder point– the number of inventory when it’s time to reorder stock. This number ensures you place a new purchase order promptly before you run out of safety stock.
Reorder point = Lead time demand + Safety stock
4. Evaluate marketing trends and planned initiatives
Review market conditions and trends for your industry such as Black Friday sales or previous marketing campaigns. If a promotion from last year isn’t being repeated, then the data from that period likely isn’t reliable. Use historical sales data and qualitative research to adjust forecasting for the new period.
Forecasting from several years of data gives you averages. However, it’s up to you to evaluate if numbers are trending down or up. For example, research shows that e-commerce retail sales are up over 33% from 2020.
Look at the following metrics to evaluate the market:
- Total sales
- Lead time demand
- Inventory turnover
- Cost of Goods Sold (COGs)
Review your future marketing initiatives. Assess how they will impact future demand when active.
5. Use inventory forecasting tools
You can use spreadsheets to calculate advanced metrics like Economic order quantity (EOQ). It’s much easier to leave the calculations to inventory solutions.
Inventory management forecasting tools help you automate data collection and metric tracking. You get real-time averages with predictive analytics that get more accurate over time. Many solutions use cloud computing so you don’t need to make a huge upfront investment on equipment. It also means any manager can access forecasting from anywhere.
Automate manual processes like reordering points and purchase orders. This ensures you never run out of stock and leave customers disappointed.
App integrations let you plug other business tools into your forecasting for greater insights. Inventory forecasting platforms streamline demand planning, increase sales, and reduce your warehousing overhead.
Conclusion
No one likes to wait to get what they want, especially not paying customers. Inventory forecasting enables you to fulfill more orders and better understand how best to manage your stock levels.
In this article, we explored how you can leverage inventory forecasting to satisfy your customers. Let’s review them below:
- Choose the right data and approach
- Plan for seasonality with comparable time periods
- Avoid stockouts by tracking forecasting metrics
- Evaluate marketing trends and planned initiatives
- Use inventory forecasting tools
Your warehouse and fulfillment teams will work more efficiently with more focused storage. Sales and customer service will enjoy being able to work with more happy customers. Your business will stop losing out on sales due to stockouts.
So what are you waiting for? Get started with inventory forecasting today!


